Want to live in Burnaby?
LET’S FIND YOU THE PERFECT HOME!

Burnaby Realtors: James Garbutt + Denny Dumas
Over 1400 individuals and families served! Over $1 billion sold since 2008!
Top 1 % of Real Estate Teams in Greater Vancouver (2017, 2018, 2019, 2020, 2021, 2023)
604.805.3115
ac.etatselaerdg@ofni
Interactive BURNABY Real Estate Map
Dive into our interactive map showcasing every neighbourhood in Burnaby, detailed with schools, amenities, and historic sales data. This innovative tool empowers you with knowledge to help guide your home buying or selling decisions with confidence.
CLICK ON THIS INTERACTIVE MAP! Explore Burnaby Real Estate, see market statistics, search the MLS for all homes, condos and townhouses for sale in the city.
Search the Burnaby Real Estate MLS Listings below for all homes, condos, and townhouses for sale in Burnaby.
You can also Explore Burnaby’s neighbourhoods to choose where you want to live. Find out about the Amazing Burnaby and its many neighbourhoods to give you the reasons to buy a home in Burnaby. There is a lot of nature, it has lots of parks, trails, and mountains, and they are all free. Another pro about Burnaby is several Skytrain stations. So transportation here is excellent. It’s only 15 minutes by Skytrain to downtown Vancouver
Sorry we are experiencing system issues. Please try again.
Burnaby Real Estate Overview
Diverse Property Types and Central Locations
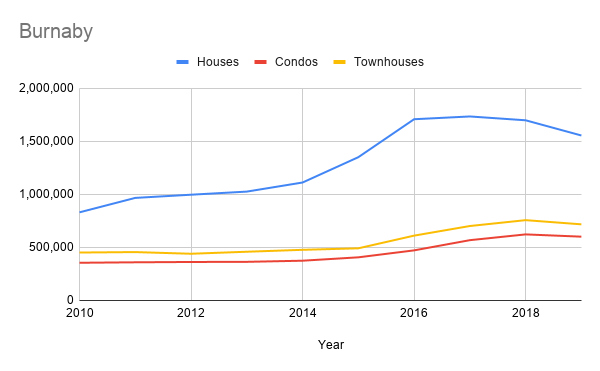
Burnaby, British Columbia’s third-largest city, is a central hub in the Metro Vancouver real estate market, offering a wide range of property types. As Burnaby Realtors, we showcase everything from high-rise condos and modern apartments in urban centers like Metrotown and Brentwood, to traditional houses and spacious townhouses in quieter neighborhoods. This diversity makes Burnaby a choice for a wide range buyers, with real estate options to suit every preference and lifestyle.
Key Neighborhoods in Burnaby
North Burnaby: Prestigious and Scenic
North Burnaby features esteemed areas such as Brentwood Park and Capitol Hill, where residents enjoy stunning mountain and city views. These neighborhoods are known for their higher-end houses and are favored by those looking for an upscale residential experience.
South Burnaby: Vibrant and Convenient
The bustling district of Metrotown, located in South Burnaby, is a magnet for those seeking condos and townhouses close to top-tier shopping, entertainment, and public transit options, encapsulating a vibrant urban lifestyle.
East Burnaby: Affordable and Growing
East Burnaby offers an appealing mix of older, more affordable homes and new developments. It’s attractive to first-time homebuyers, young families and real estate investors, highlighting the area’s growth potential.
Burnaby’s Future IN Real Estate
Sustainable Development and Connectivity
Burnaby’s real estate market is poised for continued growth, with city planning focused on sustainability and transit-oriented developments. The Official Community Plan prioritizes green initiatives and infrastructure enhancements, promising a future where residential areas are both eco-friendly and well-connected. This forward-thinking approach ensures that Burnaby remains a top choice for real estate investments and an ideal place for people to live.
By maintaining a strong focus on enhancing connectivity and supporting sustainable living, Burnaby is not just keeping pace but setting trends in the Greater Vancouver real estate market. Whether you’re looking to buy a family home, invest in a rental property, or find a high-rise condo, Burnaby offers a wealth of opportunities that cater to both current needs and future developments.
Top Burnaby Realtors
James Garbutt, a co-founder of G+D, is not only a top Realtor in Burnaby, but also a Burnaby native. Born and raised in the area, James grew up around Deer Lake with his family, then move out to his first condo in Brentwood in Burnaby. He attended Morley Elementary and St. Thomas Moore high school, both in Burnaby. James was actively involved in sports in the community. Since 2008, James has been serving the Burnaby real estate market. His extensive living experience in a variety of homes, from vintage to modern and from condos to single-family houses, both new and old, provides him with a unique insight into the diverse real estate landscape of Burnaby. This background has enabled him to successfully guide hundreds of families through the complexities of buying and selling homes in the area.
In 2014, James joined forces with Denny Dumas to form the G+D team, channeling their combined expertise into the Burnaby real estate market. Their dedication and deep market knowledge have ranked them among the top 1% of real estate teams in Burnaby and throughout Greater Vancouver. They possess extensive experience with almost every condo building in the city and a profound understanding of homes from various periods, skillfully managing zoning laws, new developments, and providing accurate property evaluations.
Are you considering buying or selling a property in Burnaby?
As top Burnaby realtors with deep roots and extensive experience in the community, we are uniquely positioned to help you navigate the local real estate market. Whether you’re looking to purchase your dream home or sell your property at the best possible price, we’re here to provide expert guidance and dedicated service. Contact us today to discuss your real estate needs and discover how we can help you make your next move a success.
THINKING OF BUYING OR SELLING? CONTACT US TODAY:
"*" indicates required fields
Learn MORE about these Burnaby neighbourhoods
BURNABY NORTH REAL ESTATE
BURNABY SOUTH REAL ESTATE
BURNABY EAST REAL ESTATE
We’d love to hear from you!

(604) 315-3300 | ac.etatselaerdg@semaj

(604) 761-6202 | ac.etatselaerdg@ynned

