Want to live in New WESTMINSTER?
LET’S FIND YOU THE PERFECT HOME!

New Westminster Realtors: James Garbutt + Denny Dumas
Over 1400 individuals and families served! Over $1 billion sold since 2008!
Top 1 % of Real Estate Teams in Greater Vancouver (2017, 2018, 2019, 2020, 2021, 2023)
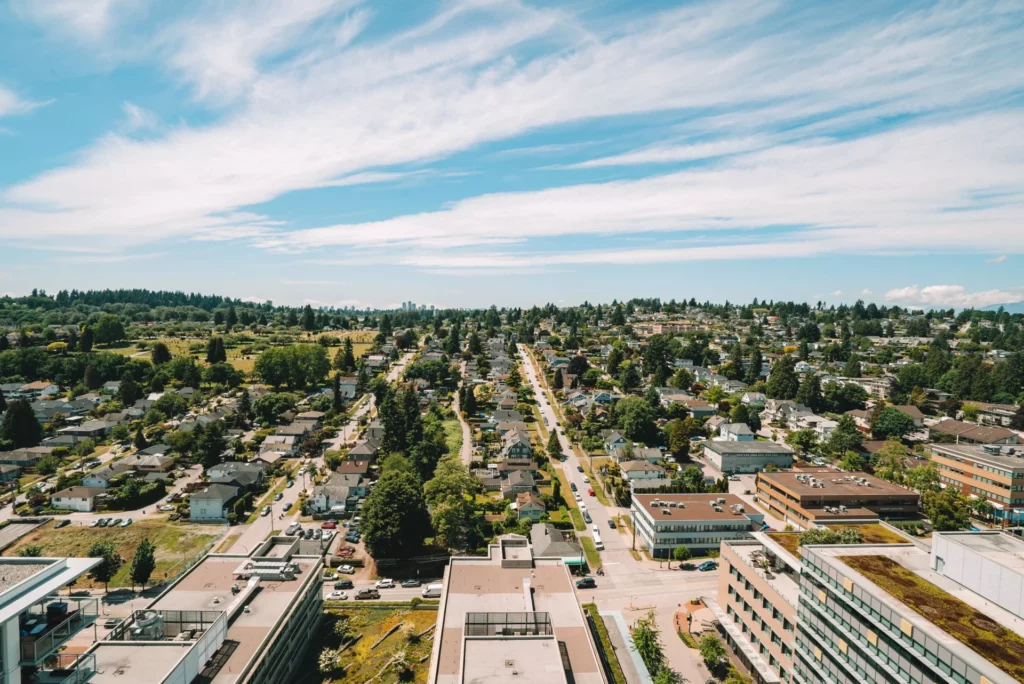
Discover New westminster
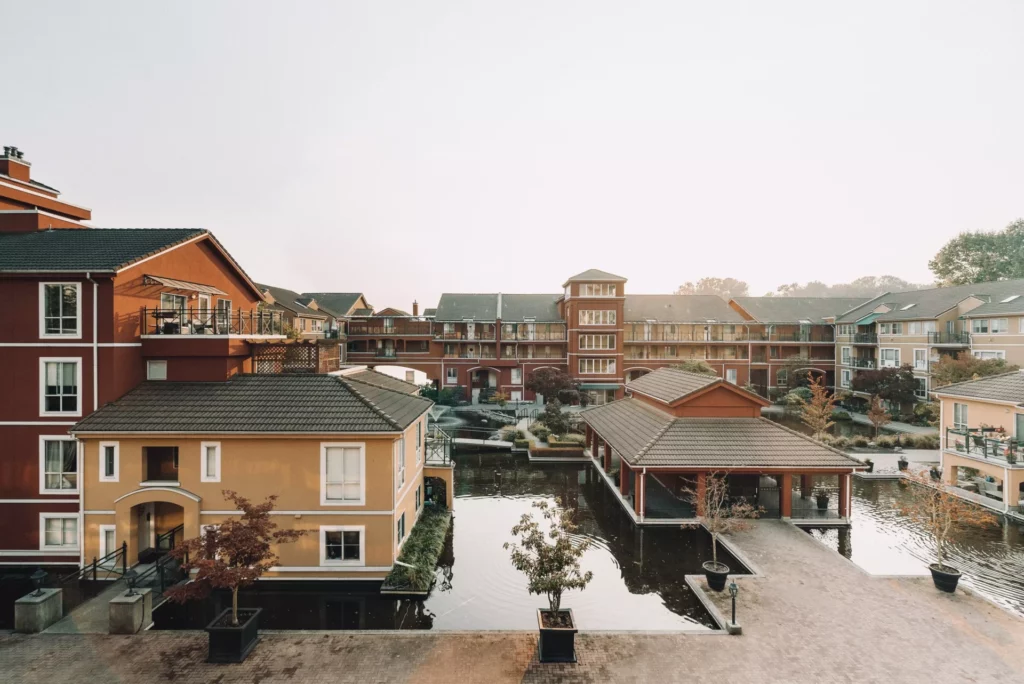
In New Westminster’s vibrant communities, you’ll find a diverse range of real estate options to suit every preference. Whether you’re drawn to the tranquil waterfront condos at the Quay, the spacious, family-friendly townhouses in Queensborough, or the historic charm of character houses in Queens Park, we’re here to help you find your ideal home.
Interactive New WEstminster Real Estate Map
Dive into our interactive map showcasing every neighbourhood in New Westminster, detailed with schools, amenities, and historic sales data. This innovative tool empowers you with knowledge to help guide your home buying or selling decisions with confidence.
CLICK ON THIS INTERACTIVE MAP! Explore New Westminster Real Estate, see market statistics, search the MLS for all homes, condos and townhouses for sale in the city.
New Westminster: A Blend of Heritage and Modern Living
Discover the charm and vibrant life of New Westminster, British Columbia’s oldest city and original capital. This city is a blend of heritage and modern living, making it an attractive destination for young families, urban professionals, and empty-nesters alike. New Westminster offers a unique mix of residential options, from cozy condos along the scenic Quay, spacious townhouses in the family-friendly Queensborough area, to beautiful character houses nestled in the lush surroundings of Queens Park.
New Westminster is celebrated for its central location and excellent transit services, ensuring everything you need is within walking distance or a short transit ride away. The city boasts diverse, walkable neighborhoods that are rich in history and community spirit, offering an eclectic lifestyle that caters to all.
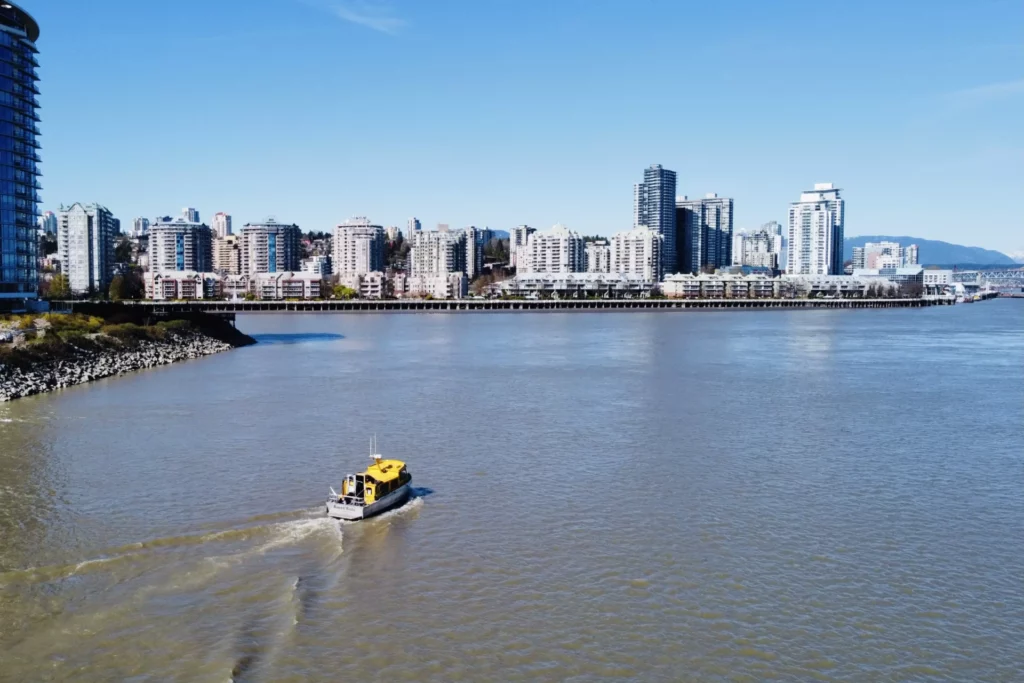
The city’s rich tapestry of culture, history, and modern amenities is evident in its bustling waterfront areas, heritage buildings, and an array of festivals and events that light up the community throughout the year. From the lively arts scene to its parks, markets, and waterfront, New Westminster combines the tranquility of suburban life with the perks of urban living.
For those interested in the local real estate market, New Westminster presents a range of properties that cater to a variety of tastes and budgets. Whether you’re drawn to the historic charm of Queens Park, the modern allure of waterfront condos in the Quay, or the spacious layouts of townhouses in Queensborough, New Westminster offers a unique living experience for everyone.
The city is not just about the places but the experiences it offers. With a vibrant food scene, shopping destinations, and outdoor activities, New Westminster is Metro Vancouver’s best-kept secret, offering unique eats, trendy shopping, and chic vintage finds. It’s a city where history meets modernity, and where community warmth and welcoming public spaces make it a perfect place to call home.
Explore New Westminster and discover why this city is quickly becoming a favored destination for those looking to buy or sell in the real estate market. Whether you’re seeking the perfect home or looking to sell, New Westminster’s diverse offerings and vibrant community life make it an ideal choice
Explore New Westminster Real Estate with Local Experts
As your New Westminster Realtors, we specialize in selling a diverse array of properties, including houses, condos, and townhouses, catering to every lifestyle and preference.
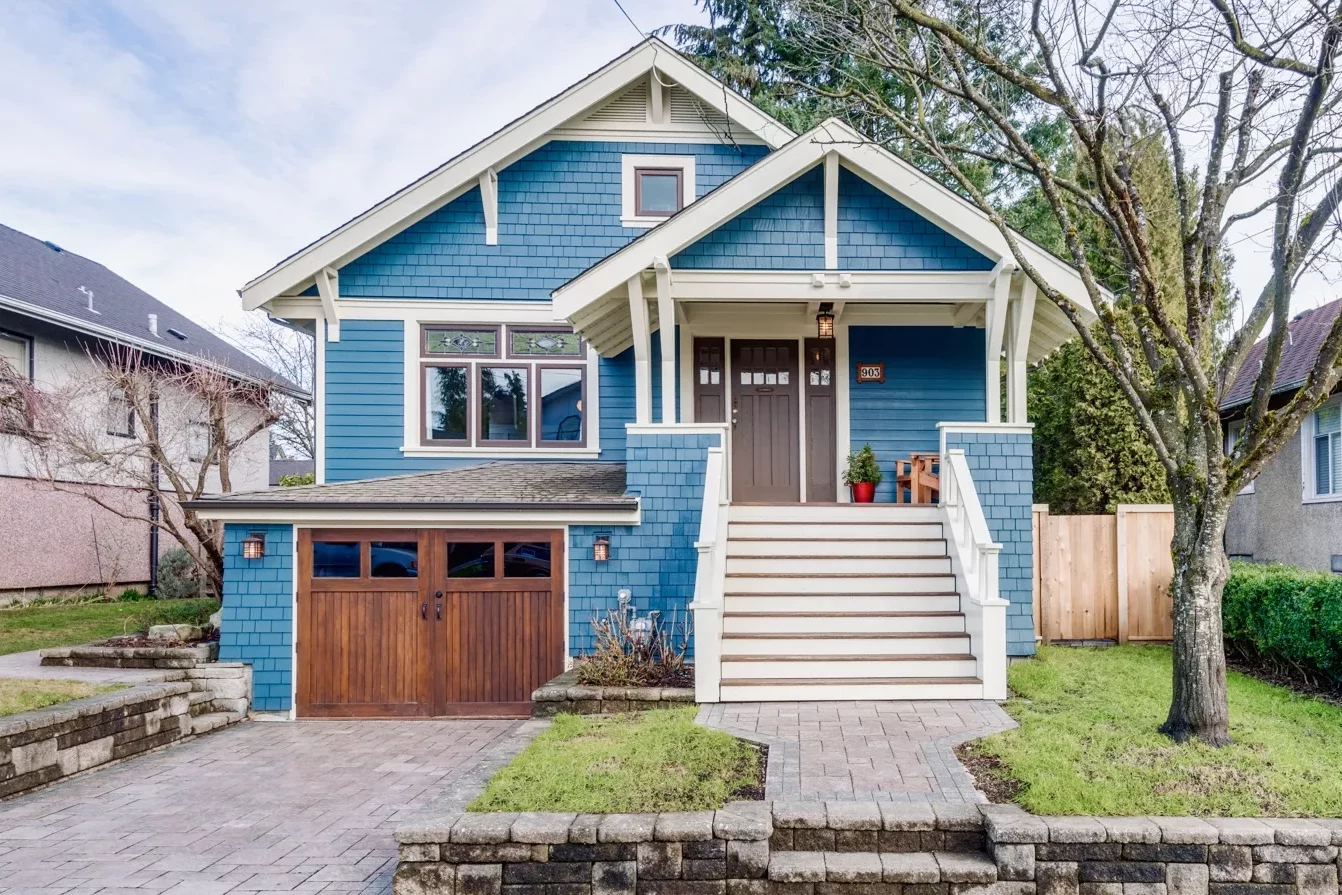
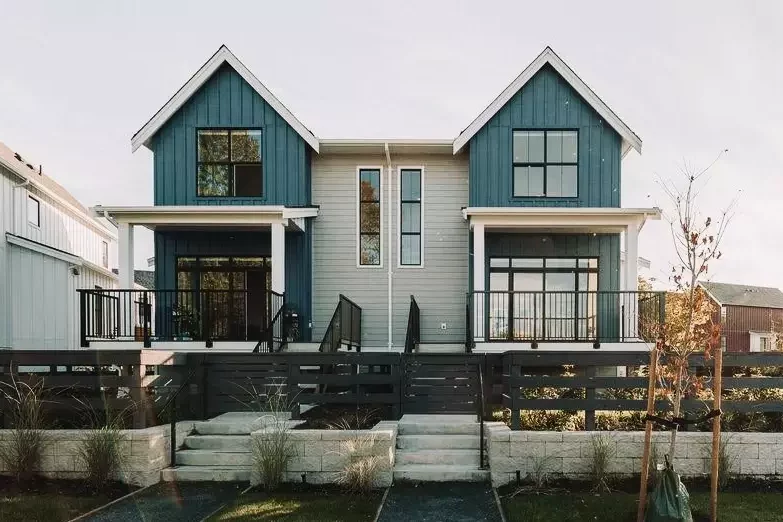
Houses in New Westminster feature a rich variety of ages, styles, and lot sizes. The city’s architectural tapestry includes heritage homes in Queens Park and Sapperton, mid-century gems in The Heights, cozy bungalows in Glenbrooke North, and contemporary craftsman-style homes in the West End. Queensborough, a newer development area, offers modern homes, row homes, and townhouses, showcasing the evolving landscape of New Westminster.
Townhouses are in high demand in New Westminster, with Queensborough hosting a significant number and more developments on the horizon. In other areas like Fraserview, Victoria Hill, Uptown, and Glenbrooke North, townhouses are available, but in limited quantities compared to the high demand for townhomes well suited for families north of the Fraser.
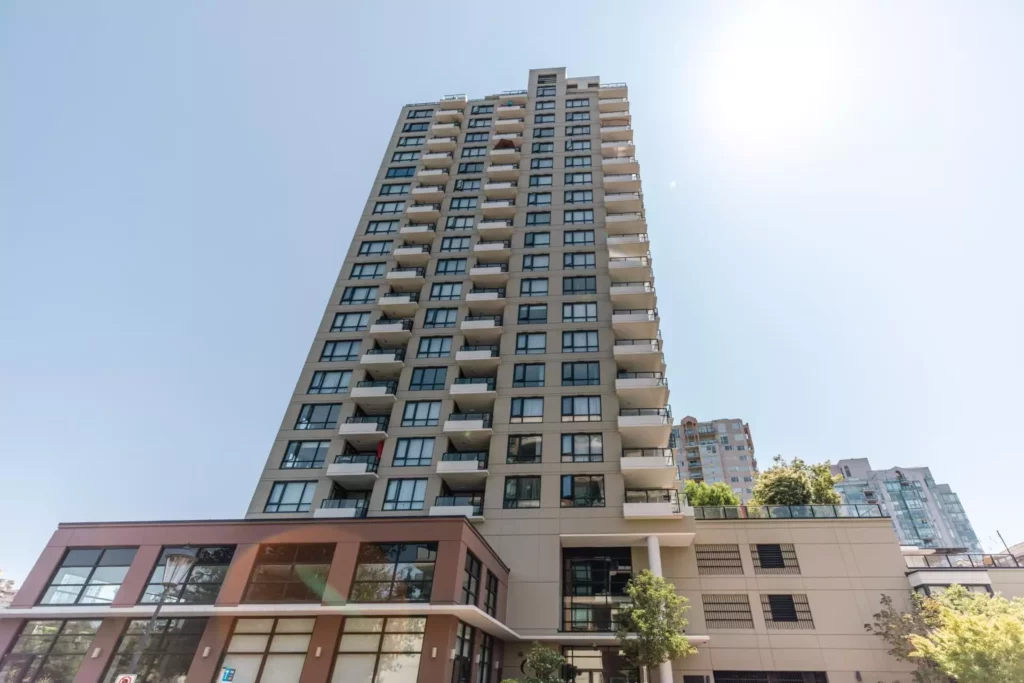
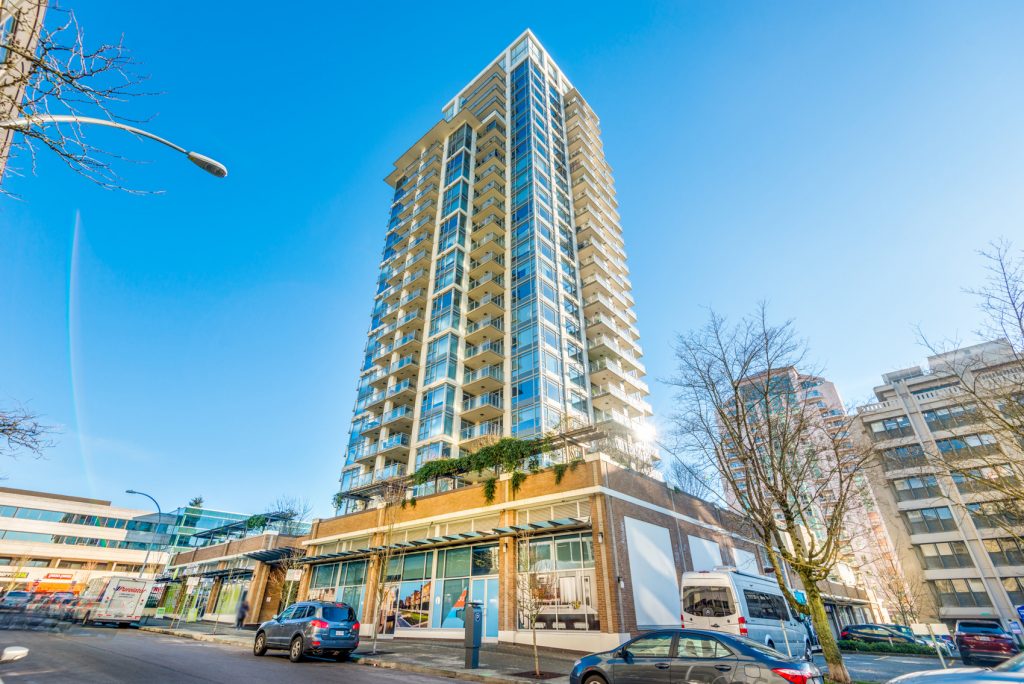
Condos are a prominent feature of New Westminster’s real estate market, supported by five SkyTrain stations that offer excellent transit connectivity. This makes condo living a practical choice, with options ranging from the modern and loft-style designs in Port Royal, Queensborough, to the mid-rise and high-rise buildings along the New West Quay. Notable developments include The Q, Murano Lofts, and Riversky, among others in master-planned communities like Victoria Hill and POrt Royal. Condos across all ages can be found in Uptown, Downtown, Sapperton, and Fraserview, with older condos offering exceptional value for space.
New Westminster’s diverse real estate portfolio ensures there’s something for everyone, from waterfront living to urban conveniences, all just 30 minutes from downtown Vancouver. Let us guide you through the vibrant neighborhoods of New Westminster to find your perfect home.
NEW WESTMINSTER MLS LISTINGS
Check out new Westminster condos, townhouses, and houses that are listed for sale
Sorry we are experiencing system issues. Please try again.
Spotlight on New Westminster Living: Diverse Home Styles
- Waterfront Condos on the Quay: Enjoy stunning river views and vibrant community life.
- Heritage Homes in Queens Park: Live amidst history in beautifully preserved residences.
- Charming Homes in Glenbrooke North: Perfect for those seeking a quiet, family-friendly neighborhood.
- Mid-Century Homes in The Heights: Ideal for lovers of vintage charm and character.
- Downtown and Uptown Condos: Modern living in the heart of the city, offering convenience at every turn.
- Victoria Hill: Surrounded by greenery, these condos and townhouses offer a serene living environment.
- Queensborough Townhouses and Row Homes: Spacious living with modern amenities.
- Port Royal in Queensborough: A waterfront community known for its condos and townhouses with stunning views.
- Sapperton: A blend of modern condos and charming houses, close to essential amenities.
amenities:
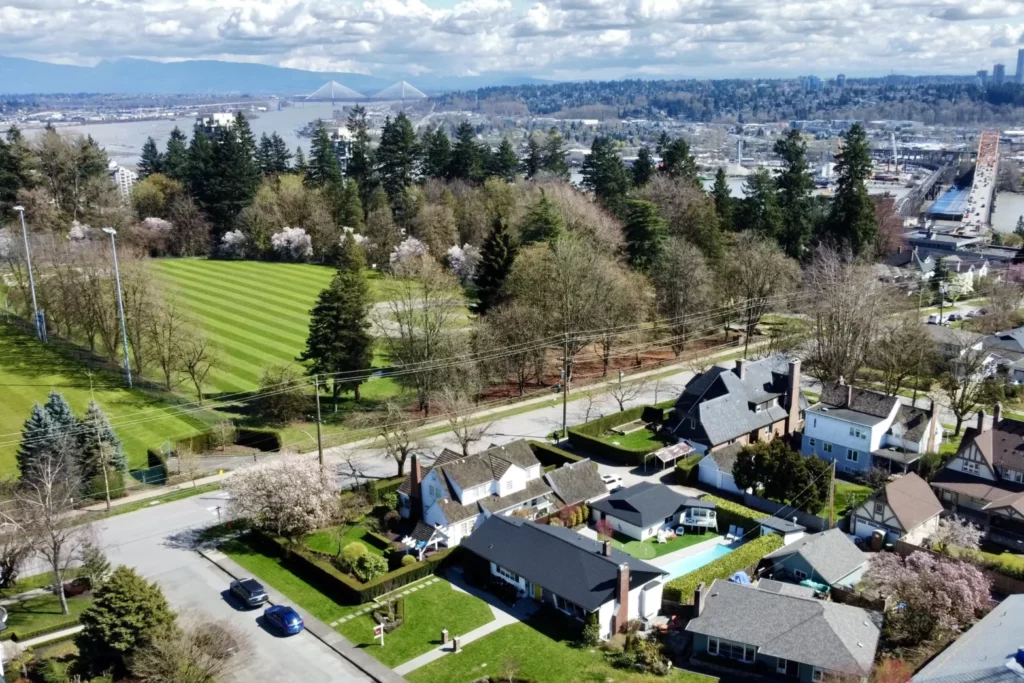
- Historic Queens Park: The heart of the city, offering lush green spaces, walking trails, tennis, playground, waterpark and recreational facilities.
- Moody Park: A hub for sports, leisure, outdoor pool and community events, complete with a pool and water park.
- Hume Park: Enjoy outdoor activities, outdoor pool, a playground, and waterpark, ideal for families.
- Waterfront Pier Park and Quay Boardwalk: Explore the scenic beauty of the riverfront, playground, grass field, perfect for leisurely walks.
- SkyTrain Stations: With five stations across the city, commuting and exploring the Greater Vancouver area is effortless.
New Westminster’s diverse property offerings and rich array of amenities make it a sought-after destination for buyers and sellers alike. Whether you’re drawn to the tranquility of waterfront living, the charm of historic neighborhoods, or the convenience of urban condos, New Westminster provides a unique blend of options to call home.
As your dedicated real estate experts in New Westminster, we’re here to guide you through the journey of finding your perfect home or selling your property in this vibrant community. Explore the possibilities with us and discover why New Westminster stands out as a top choice for real estate in the Greater Vancouver area.
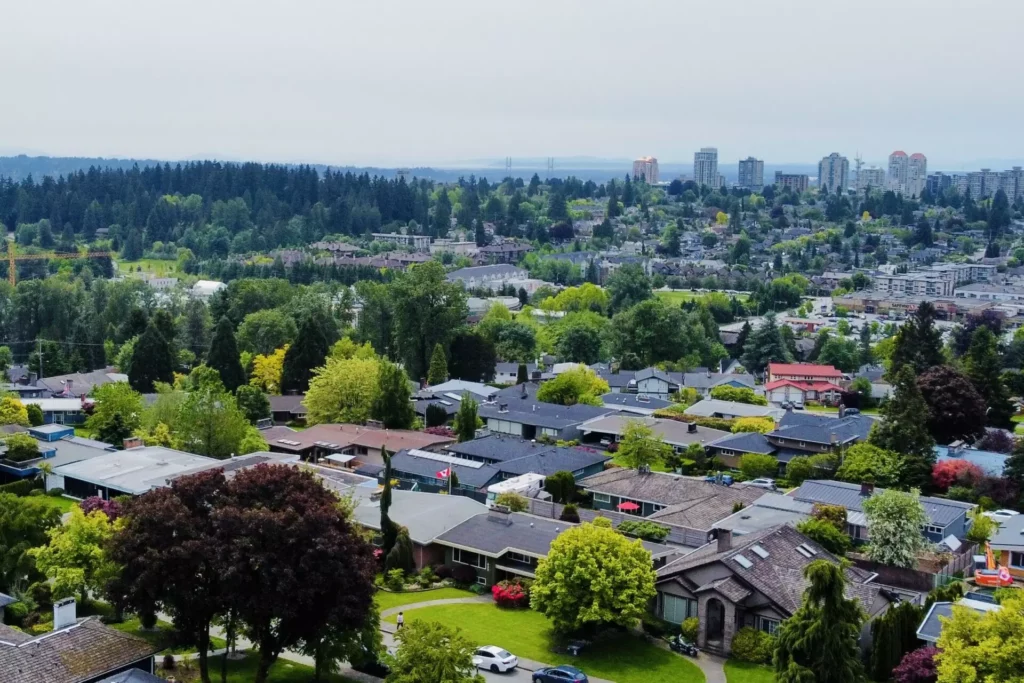
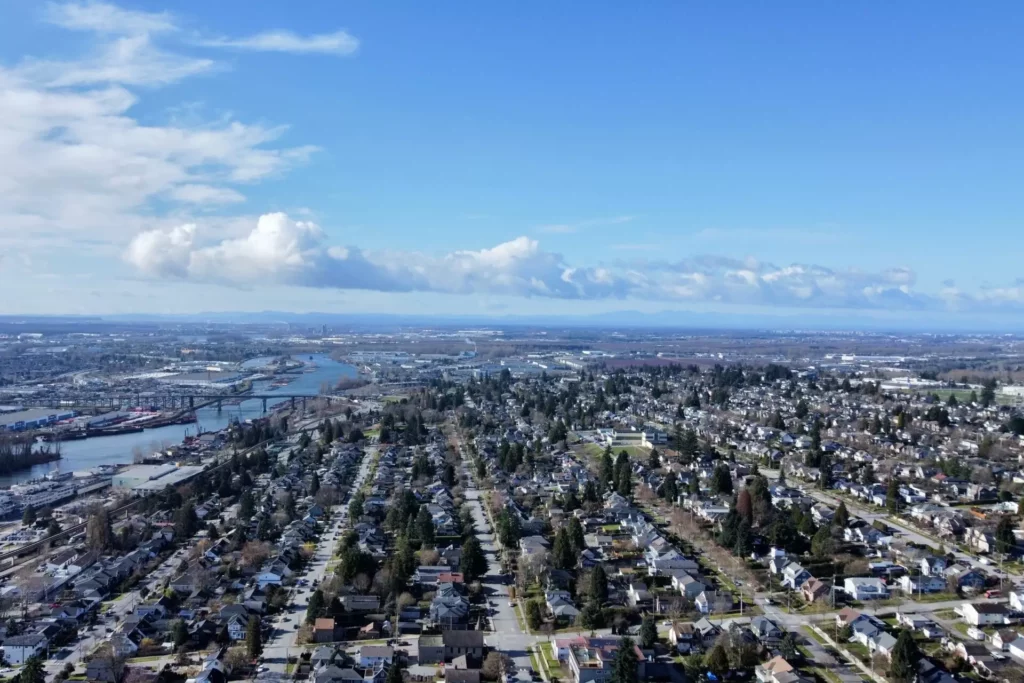
New Westminster neighbourhoods
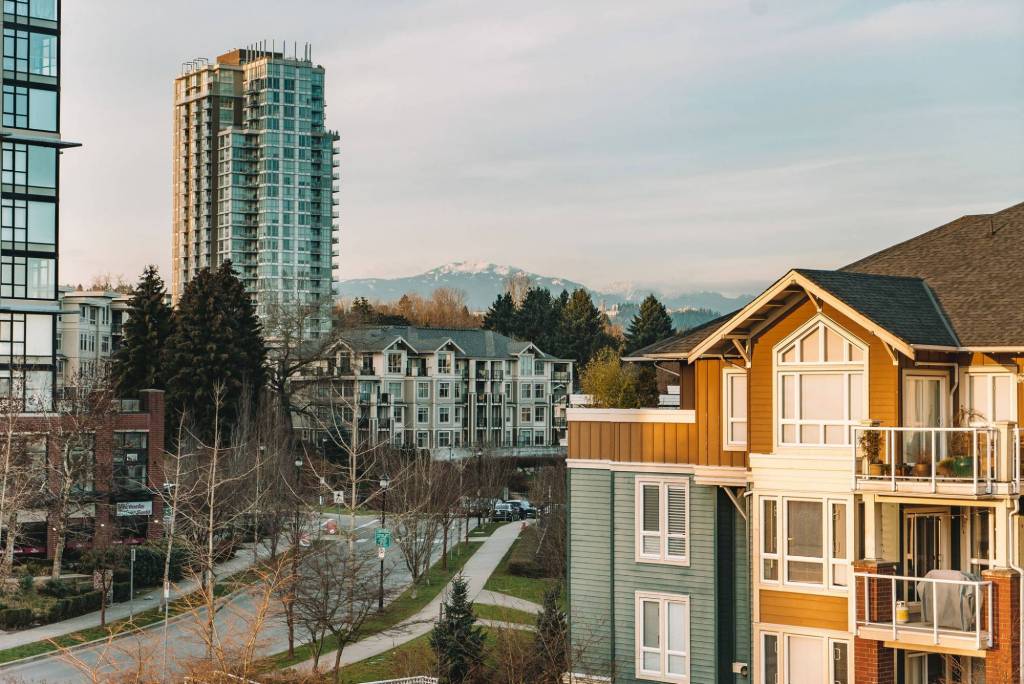
Dive into New Westminster’s real estate history with our overview of housing prices and trends across key neighborhoods. From Connaught Heights’ tranquility to Downtown’s vibrant streets, Fraserview’s views, Glenbrooke North’s family appeal, Moody Park’s community vibe, the Quay’s waterfront charm, Queens Park’s heritage, expanding Queensborough, historic Sapperton, lively The Heights, and bustling Uptown, gain insights into the market dynamics that have shaped these areas.
Whether seeking a home or investment, understanding past market trends is invaluable. Guided by experienced New Westminster real estate agents, explore what makes each neighborhood distinct and how historical data informs today’s New Westminster real estate decisions.
top 3 single family home neighbourhoods in NEW WESTMINSTER: A LOCAL REALTOR’s GUIDE By james garbutt

THE HEIGHTS
Discover the charm of The Heights in New Westminster, a picturesque neighborhood known for its mid-century allure and spacious, landscaped lots. With many homes dating back to the 1950s, this area offers stunning views of Mount Baker, the Fraser River, and the Port Mann Bridge, thanks to its gently sloped streets that capture the sunlight beautifully. The lots, often exceeding 6,000 sqft with wide frontages, contribute to a serene, low-density environment filled with greenery and mid-century modern homes that boast simple, yet captivating curb appeal.
Rooted in history, The Heights was initially developed for returning veterans, creating a community with a strong sense of belonging and pride. Today, it remains a family-friendly oasis within the city, celebrating its heritage with annual community events like garage sales and block parties. The neighborhood’s architecture, a mix of historic and modern styles set against a backdrop of historic streetlights, underscores its unique character and commitment to preserving its mid-century modern essence. A true gem in New Westminster, The Heights offers a peaceful, yet vibrant living experience for those who value both heritage and community.
QUEENS PARK
Queens Park in New Westminster could be the haven you’re seeking, with its rich tapestry of history and modern conveniences blending seamlessly. This prestigious neighborhood, one of the oldest in New Westminster, is renowned for its beautifully preserved heritage homes and lush, tree-lined streets. Imagine strolling down avenues lined with cherry blossoms or historic homes from the late 1800s and early 1900s, each telling a story of a bygone era. The area adheres to the Queens Park Heritage Design Guidelines, ensuring that any new development honors the neighborhood’s storied past, offering a unique charm that’s hard to find elsewhere.
Living in Queens Park means having the best of both worlds: the tranquility of a residential neighborhood and the vibrancy of urban living just minutes away. The community is nestled next to Queen’s Park, offering families and outdoor enthusiasts a plethora of activities right at their doorstep, from playgrounds and sports fields to picturesque walking trails. With highly regarded schools like Herbert Spencer Elementary nearby, it caters to educational needs within a nurturing environment. Plus, the convenience of being a short walking distance to the Columbia SkyTrain Station opens up effortless commutes to Downtown Vancouver and beyond. If you’re envisioning a life where historical charm meets modern living, Queens Park might just be the perfect setting for your new home.
West END
The West End in New Westminster is a picturesque neighborhood, appreciated for its heritage charm and beautiful vistas overlooking the Fraser River. It’s characterized by its sloping landscapes, where a mix of well-maintained single-family homes dominate, offering sunny and serene living spaces. Increasingly, the area is seeing a shift towards more diverse housing options, including condos and the anticipated arrival of townhouses to meet the growing need for family-oriented middle housing. This shift aims to enrich the community’s residential fabric by introducing more varied living options.
Strategically located for ease of access to both the city’s Uptown and Downtown areas, the West End is surrounded by convenient amenities and is well-connected by transit, including proximity to two SkyTrain stations. This ensures residents enjoy both the tranquility of a residential area and the vibrancy of urban life. Parks like Grimston and Moody offer extensive recreational options, enhancing the neighborhood’s appeal for active and family-focused residents. The real estate landscape is evolving, with a trend towards diversification, yet it remains anchored by its character homes and the promise of expanding its welcoming community.
most affordable single family home neighbourhood
Sapperton
Sapperton tops the list as one of the most affordable neighbourhoods in New Westminster. This area combines historical charm with modern convenience, largely attributed to its smaller average lot and home sizes, which introduce higher density and affordability. Named after the Royal Engineers, “The Sappers,” who played a pivotal role in the city’s early development, Sapperton has grown into a vibrant community.
Residents of Sapperton enjoy proximity to Hume Park, featuring a water park, playground, and outdoor pool, making it ideal for families. The neighbourhood’s accessibility is enhanced by two SkyTrain stations, Sapperton and Braid, ensuring seamless connectivity. Furthermore, the presence of the Royal Columbian Hospital underscores Sapperton’s importance within the region.
Real estate in Sapperton is characterized by a mix of single-family homes and condos, with townhouses present but in lower supply. The ongoing redevelopment around the Royal Columbian Hospital and the emergence of the Brewery District have infused new energy into the neighbourhood, promising a blend of residential, commercial, and healthcare developments.
Top 10 Condo Developments in New Westminster: A Local Realtor’s Guide
Discover the best condo buildings in New Westminster, a city known for its vibrant community, rich history, and stunning waterfront views. Whether you’re a potential homebuyer or simply exploring, here’s a curated list of the top condo developments, each with its unique charm and offerings.
- Murano Lofts – 10 Renaissance & 7 Rialto, New West Quay
- Year Built: Early 2006, 2007
- Developer: Aragon Properties
- Stories/Units: Varied stories; multiple units
- Features: Inspired by New York-style lofts, Murano Lofts feature double-height ceilings, reclaimed wood floors, and spectacular river views. The development emphasizes artistic design and waterfront living.
- The Q – 1 Renaissance Sq, New West Quay
- Year Built: 2009
- Developer: Aragon Properties
- Stories/Units: 24 stories; 153 units
- Features: Offering modern living spaces, The Q stands out with its contemporary finishes, open floor plans, and stunning balconies overlooking the Fraser River.
- Quantum – 39 Sixth St, Downtown New West
- Year Built: 2009
- Developer: Bosa Properties
- Stories/Units: 19 stories; 122 units
- Features: Quantum combines luxury with convenience, located steps away from shopping, dining, and public transit. Amenities include a fully-equipped gym and landscaped gardens.
- Riversky by Bosa – 988 and 908 Quayside Dr, New West Quay
- Year Built: 2019
- Developer: Bosa Properties
- Stories/Units: 33 stories; 285 units
- Features: Riversky features innovative SmartSpace™ designs and riverside living with amenities like a yoga studio, rooftop terrace, and pet washing station.
- Parkside – 271 Francis Way, Victoria Hill
- Year Built: 2016
- Developer: Onni Group
- Stories/Units: 22 stories; 139 units
- Features: Nestled in a green oasis, Parkside offers expansive views, luxurious finishes, and over 40 acres of public green spaces, including a community garden.
- Trapp & Holbrook – 668 Columbia St, Downtown New West
- Year Built: 2015
- Developer: Salient Group
- Stories/Units: 20 stories; 196 units
- Features: This development revitalizes two historic facades, offering a unique blend of heritage and modernity right in the heart of the city’s cultural epicenter.
- C2C Lofts – 549 Columbia, Downtown New West
- Year Built: 2002
- Developer: Not specified
- Stories/Units: Low-rise; 45 units
- Features: Once a post office, this unique heritage conversion into lofts offers expansive spaces, high ceilings, and a location adjacent to vibrant arts and entertainment venues.
- The Peninsula – 210 Salter, Queensborough
- Year Built: 2017
- Developer: Aragon Properties
- Stories/Units: 22 stories; 163 units
- Features: A luxury waterfront community offering high-end finishes, spectacular views, and extensive amenities, including a marina and waterfront walkway.
- The Brewery District – 200 & 258 Nelson’s Court, Sapperton
- Year Built: 2017, 2020
- Developer: Wesgroup Properties
- Stories/Units: Various; multiple units
- Features: A dynamic, mixed-use community offering modern residences, shopping, and healthcare facilities, all connected by pedestrian-friendly streets.
- Ovation – 823 Carnarvon, Downtown New West
- Year Built: 2024
- Developer: Domus Homes
- Stories/Units: 32 stories; 204 units
- Features: Ovation celebrates the arts with its location near theaters and galleries, offering residents luxurious amenities and proximity to the SkyTrain for easy commuting.
New Westminster’s condo market is diverse, offering everything from heritage lofts to modern high-rises, each development contributing to the city’s vibrant community and lifestyle. Whether you’re looking for waterfront views or downtown convenience, New Westminster has a place for you.
Looking FOR A New Westminster REALTOR? WE CAN HELP!

Looking to sell your New Westminster property?
Our targeted marketing strategies and deep knowledge of the local market are designed to highlight your property, from Quay condos to Queensborough townhouses and Queens Park character homes, ensuring it captures the attention of serious buyers. We’re dedicated to not only making your property stand out but also to securing the best possible sale price, streamlining the process for a smooth and rewarding experience.
Why Choose Us?
- Tailored Service: We customize our strategies to meet your specific needs, whether you’re buying or selling.
- Local Market Knowledge: We possess an intimate understanding of New Westminster’s real estate landscape, from luxury neighborhoods and heritage homes to new constructions and waterfront condos.
- Staging and Showing Expertise: We excel in showcasing the unique charm, character, and history of your home, sharing its story to make potential buyers feel truly at home.
- Client-First Approach: At G+D, prioritizing our clients’ interests is paramount. Whether you’re buying or selling, our goal is to find your ideal home or maximize your property’s value, ensuring a seamless and beneficial transaction.
New Westminster Realtors
James Garbutt, a co-founder of G+D, is a experienced realtor in New Westminster, serving the community since 2008. His deep connection to the area, having lived in a variety of homes from vintage to modern, across condos to single family houses, new and old, gives him a rich perspective on the diverse real estate landscape of the city. This experience has empowered him to successfully guide hundreds of families through the complexities of buying and selling homes in New Westminster.
In 2014, James teamed up with Denny Dumas to form the G+D team, focusing their joint expertise on New Westminster real estate. They handle an eclectic mix of properties, from Queens Park’s heritage homes, mid-century gems in The Heights, waterfront condos along the Quay, high-rises in Victoria Hill and Downtown, and townhouses in Queensborough. Their dedication and knowledge have placed them among the top 1% of real estate teams in Greater Vancouver, with their operations centered in New Westminster. They boast comprehensive experience with almost every condo building in the city and a deep understanding of homes from every period, adeptly navigating zoning laws, development prospects, and providing accurate property assessments.
Beyond their professional achievements, James and Denny are deeply committed to the New Westminster community. They actively support and participate in local events, including those hosted by Steel & Oak Brewing Company, the New Westminster Rotary Club, various school and sports fundraisers, and farmers’ markets, showcasing their dedication not just to real estate but to enriching their community as well.
Join us on your real estate journey in New Westminster. From the tranquil waterfront to vibrant community hubs, we’re here to help you realize your real estate dreams. Together, we’ll navigate the market to find or sell your ideal property. Let’s get started on making your next move a resounding success.

(604) 315-3300 | ac.etatselaerdg@semaj

(604) 761-6202 | ac.etatselaerdg@ynned
THINKING OF BUYING OR SELLING? CONTACT US TODAY:
"*" indicates required fields
