Vancouver

CLICK ON THIS INTERACTIVE MAP!  It’s interactive and loaded with helpful information.   Explore North Vancouver Real Estate MLS Listings, see market statistics, search the MLS for all homes, condos and townhouses for sale in the city.

NORTH VANCOUVER

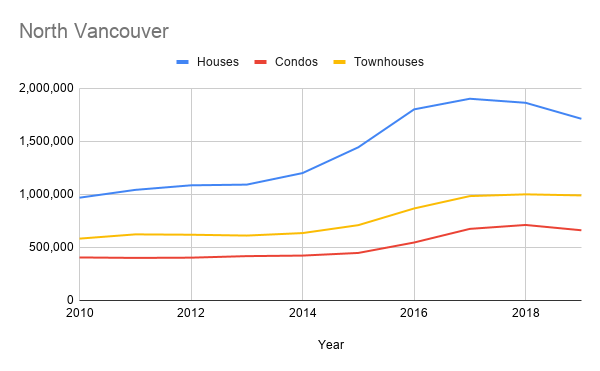
If you are looking for North Vancouver Real Estate here are a few things to know about it.  The City of North Vancouver is a waterfront municipality on the north shore of Burrard Inlet, directly across from Vancouver, British Columbia. It is the smallest of the three North Shore municipalities and the most urbanized as well. Although it has a significant industry of its own, including shipping, chemical production, and film production, the city is usually considered to be a suburb of Vancouver.

652 Results
3
Beds
2 | 1
Baths
1,930
SqFt
(35)
 
 
#R2864699 | Condo
Courtesy of Oakwyn Realty Ltd.
6
Beds
5 | 1
Baths
4,037
SqFt
(40)
 
 
#R2875679 | House
Courtesy of Sutton Group-West Coast Realty
6
Beds
5 | 1
Baths
4,239
SqFt
(36)
 
 
#R2875665 | House
Courtesy of VIRANI REAL ESTATE ADVISORS
3
Beds
2 | 1
Baths
1,857
SqFt
 
 
#R2875544 | Condo
Courtesy of RE/MAX Results Realty
6
Beds
2
Baths
2,125
SqFt
 
 
#R2875571 | House
Courtesy of Coldwell Banker Prestige Realty
4
Beds
5
Baths
3,197
SqFt
(20)
 
 
#R2875555 | House
Courtesy of Royal LePage Sussex
3
Beds
1 | 1
Baths
1,467
SqFt
(31)
 
 
#R2875469 | Condo
Courtesy of Rossetti Realty Ltd.
2
Beds
2
Baths
975
SqFt
 
 
#R2875465 | Condo
Courtesy of Royal LePage Sussex
1
Beds
1
Baths
731
SqFt
 
 
#R2875456 | Condo
Courtesy of Royal Pacific Lions Gate Realty Ltd.
3
Beds
2 | 1
Baths
1,637
SqFt
 
 
#R2875435 | Condo
Courtesy of RE/MAX Crest Realty
5
Beds
3 | 1
Baths
3,173
SqFt
 
 
#R2875459 | House
Courtesy of Stilhavn Real Estate Services
3
Beds
1 | 1
Baths
1,809
SqFt
 
 
#R2875438 | House
Courtesy of Royal Pacific Lions Gate Realty Ltd.
Copyright 2024 Greater Vancouver REALTORS®. All rights reserved.
NOTE: This representation is based in whole or in part on data generated by the Chilliwack & District Real Estate Board, Fraser Valley Real Estate Board or Greater Vancouver REALTORS® which assumes no responsibility for its accuracy. In Canada, the trademarks MLS®, Multiple Listing Service® and the associated logos are owned by The Canadian Real Estate Association (CREA) and identify the quality of services provided by real estate professionals who are members of CREA.
GVR Res data last updated at April 26, 2024 9:14 AM PT

THINKING OF BUYING OR SELLING? CONTACT US TODAY:

"*" indicates required fields

Name*

NORTH VANCOUVER NEIGHBOURHOODS


North Vancouver Real Estate MLS Listings Prices & Stats

North Vancouver Real Estate MLS Listings House Prices

YearAverageHighLowMedianAvg $/SfMedianAVG After 2000AVG Before 2000Avg DOMCount
2010969,2396,180,000137,000892,7133883721,056,195925,6493858
20111,042,8806,200,00037,000949,4374083881,198,250988,0243565
20121,085,8975,000,000149,9001,006,9264264101,291,5011,018,2213454
20131,092,4246,000,000140,000990,9324194051,395,0571,000,2074264
20141,201,2697,000,000185,0001,091,5314504251,601,4471,094,9663372
20151,444,48910,000,000185,0001,338,1155395101,878,7471,314,4942389
20161,801,79310,800,000200,0001,635,0007276502,574,9411,696,137181231
20171,901,93611,100,000140,000140,0007156612,736,9401,737,437261039
20181,863,8025,500,000405,0001,675,0006836492,618,7641,672,97235679
20191,713,0005,000,000690,0001,550,0006305972,467,1771,533,34641788

North Vancouver Real Estate MLS Listings Condo Prices

YearAverageHighLowMedianAvg $/SfHighLowMedianAVG After 2000AVG Before 2000Avg DOMCount
2010405,9401,920,000154,750379,583457800264455448,028367,62641182
2011401,6052,250,000146,000369,526457787265448453,463354,57449185
2012403,9482,125,000151,000383,489457934254455449,867362,37051141
2013418,3671,530,000135,000378,740459788251452532,174351,63354154
2014423,4671,940,000145,000395,297470886258469496,183349,47148179
2015448,4532,065,000165,000409,910509952287516525,951363,78442261
2016546,6412,625,000170,000479,9506242,035258605652,768447,779171298
2017675,3255,100,000185,000619,0007651,941305753772,259565,756161291
2018712,1733,400,000295,800650,0008171,625411819799,618610,81820950
2019662,1052,525,000255,000620,5007701,629390770738,468566,363341000

North Vancouver Real Estate MLS Listings Townhouse Prices

YearAverageHighLowMedianAvg $/SfHighLowMedianAVG After 2000AVG Before 2000Avg DOMCount
2010583,3891,180,000241,000568,026374496246372588,085554,0273234
2011623,3711,215,000228,000620,626381508279371605,834570,7993636
2012620,0531,262,500254,900614,453382499295376635,057557,2983726
2013612,2001,307,000300,000605,916382497280380624,090582,7235132
2014635,6571,335,000231,000639,242393515275392624,667608,9983733
2015710,3422,188,000292,000700,227437575313434700,913669,0252844
2016867,6551,980,000304,900848,000547913282548903,573846,37217387
2017984,3252,200,000382,500965,0006181,2163116331,036,110948,90816357
20181,000,7802,399,000485,000975,0006521,2663356641,094,713929,37025301
2019990,7752,088,000528,000965,0006081,0712545991,093,014909,07436324