Renfrew is a residential neighbourhood located just north of Renfrew Heights and south of the PNE. E Hastings St and Grandview Hwy mark its northern and southern borders respectively, while Boundary Rd and Nanaimo St mark its eastern and western borders. The neighbourhood has beautiful tree-lined streets and great curb appeal with houses set back from the sidewalk.
Neighbourhood Amenities
Small commercial districts can be found along E 1st Ave, E Hastings and Grandview Hwy. There, grocery stores, ethnic restaurants and more can be found. All of the amenities of Renfrew are also a short bus ride, drive or bike ride away.
Rupert Park is Renfrew’s most notable park right off Highway 1; it features open green spaces, a playground and tennis courts. Visitors can also play on the pitch and putt course on the eastern part of the park. Just off Renfrew, the PNE Fair Grounds can found, which is one of the city’s hottest attractions in the summer, hosting hosts live music, food, drinks and an annual exhibition.
Schools
- Dr. AR Lord Elementary (K-7)
- Sir Matthew Begbie Elementary (K-7)
- Chief Maquinna Elementary (K-7)
- Vancouver Technical Secondary (8-12)
Transit
Buses run along Renfrew, Hastings St, E Broadway and Rupert St that transfer users to Renfrew and Rupert Skytrain Stations. Drivers too can easily access E Hastings St, E Broadway and Highway 1.
Renfrew Real Estate
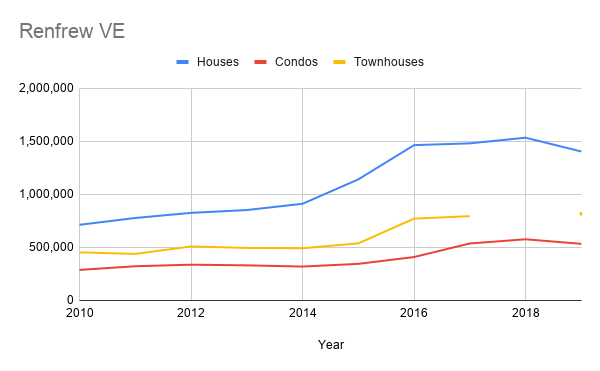
Detached home dominate the market in Renfrew, with condo towers beginning to develop around Skytrain areas.
Sorry we are experiencing system issues. Please try again.

