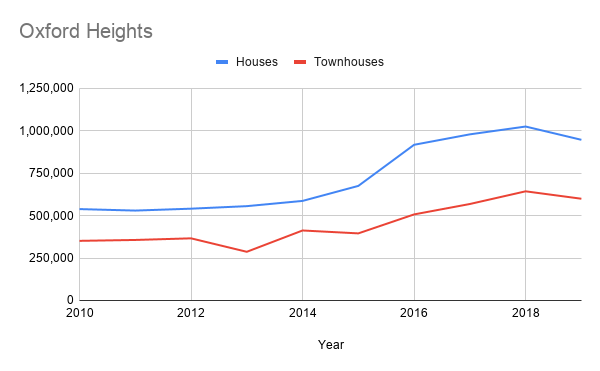
Oxford Heights Port Coquitlam is a neighbourhood bordering Coast Meridian, meaning it has easy access to busses, grocery stores, independent businesses, and coffee shops. It is primarily a residential area, and residents are able to enjoy the quiet while still being close to anything they need.
Oxford Heights is in the central north side of Port Coquitlam, and border’s Coquitlam’s Burke Mountain subarea. Many of the homes are on the greenbelt as the neighbourhood has a variety of creeks and walking trails. Although most of the homes are detached homes, there are some townhomes in the neighbourhood as well. The main road, Coast Meridian, provides easy bus access in and around the rest of Port Coquitlam making it an easy area to get around.
Schools
- Leigh Elementary / Irvine Elementary (K-5)
- Kwayhquitlum Middle School / Minnekhada Middle School (6-8)
- Terry Fox Secondary School (9-12)
- Our Lady of Assumption
- British Columbia Christian Academy
- Archbishop Carney Secondary
Transit
The new Evergreen Skytrain Extension that connects the Tri-Cities to the rest of Metro Vancouver does not stretch through Port Coquitlam; however, a number of busses will take you in to a nearby station so that you can catch the train. Transit runs along main roads such as Coast Meridian, Lincoln, and Victoria in and around Port Coquitlam and to the station. From there you can catch a variety of busses that will take you directly to Coquitlam station for the SkyTrain into Vancouver. The Westcoast Express train at Port Coquitlam station is another great option for anyone working in Vancouver, as it is an express train with limited stops that brings commuters into Vancouver’s Waterfront area.
Sorry we are experiencing system issues. Please try again.

