Coquitlam East flanks the Lougheed Highway between the eastern border of Mundy Park and Colony Farms. Many of its large homes are situated on a hillside, affording scenic views east towards Mount Baker.
Neighbourhood amenities
Coquitlam East’s proximity to two major parks offers residents a myriad of recreational opportunities.
Mundy Park is a 435-acre forested playground of hiking trails, sports fields, baseball diamonds, playgrounds, picnic areas and outdoor pool. It’s a forested oasis in the middle of suburbia.
Nearby Colony Farm offers walking trails through meadows and marshes that offer spectacular views of the surrounding mountains as well as opportunities to see migratory birds.
The neighbourhood also wraps around the grounds of the old Riverview Hospital, a former mental health care facility that is on the Canadian Register of Historic Places. Most of the buildings are now empty of patients, and the grounds are resplendent with mature and ornamental trees.
Shopping and services are close by along the Lougheed Highway to the west, or in the Town Centre area to the northeast.
Schools
- Riverview Park Elementary (K-5)
- Hillcrest Middle School (6-8)
- Charles Best Secondary (9-12)
Transit
This neighbourhood has limited TransLink service. Lougheed Highway is very accessible and the neighbourhood is only a 10 minute drive from Highway 1.
Coquitlam East real estate
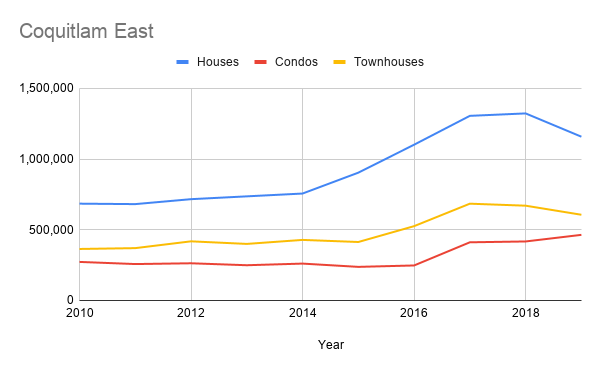
Coquitlam East is comprised of townhomes, apartments, detached homes and condos for sale. Detached homes dominate the market but townhomes and condos can be found in smaller supplies.
Sorry we are experiencing system issues. Please try again.

